
Originally published on Medium: Read on Medium

Photo by Wander Fleur on Unsplash
Background
The web has several tools, such as Google Lighthouse, to measure performance. But what about mobile apps?
One of the key Metrics to measure the performance of your mobile app is the frame rate. You want your app to run at 60fps (frames per second) to give an impression of smoothness.[60fps and 16ms barriers]
60 frames in 1s => 60 frames in 1000ms => 1 frame in 1000/60 = 16.66 ms per frames
Performance Testing Metrics
- Measure FPS for Application.- Measure CPU Usage of all threads running for an App.- Measure CPU Usage (UI Thread) — In the case of React Native only- Measure *CPU Usage* JS Thread (mqt_js) — In the case of React Native only- Measure CPU Usage (UI Thread + 1.ui Thread) — in the case of Flutter only- Measure Memory UsageDisclaimer: I have tested all measurements on Linux + Android Systems. But the same should follow for any other system.
Possible Options
Using React Profiler
The Profiler measures how often a React application renders and what the “cost” of rendering is.- Used for Optimizing the performance, but we are looking for measuring it for now. Hence ❌.
- Using FPS Meter
- FPS Meter is an app to be installed into real devices from Play Store, displaying FPS value over apps after permission. Only displays FPS value and not other metrics.- Also, FPS values don’t fluctuate much. Always between 57FPS — 60FPS. Hence ❌.

FPS Meter — Android Playstore

Showing fps value at the bottom right on App.
- Using Flipper + React DEV-Tools
- use via Flipper Desktop app or npx flipper-serverin terminal.- Seems to be promising for optimizing and Measuring the metrics via plugins like flipper-rn-perf, android performance-profiler.

- Problems: Sometimes React-dev-tools become disabled, and other installed plugins remain unavailable(see rn-perf-monitor below) / not showing in the list of plugins(see android-performance-profiler), hence can’t use them to measure.- *Solution Pending**: *Not able to figure out how to make these unavailable plugins, available and use them. Hence ❌.

Unavailability/no-sign of required/installed plugins + React DevTools remains unavailable.
- Using Flashlight** **🔦
- worked like a charm for all the Metrics and more, even for other apps built with flutter! as it works for apps running on emulators/real devices powered by android-studio or x-code for ios or android.
How to measure?
- install flashlight in cmd.
to run app
- start your app,
npm startorflutter runor something.
to run on android on react-native
- npm run android
start measuring.
flashlight measure
Play with you app.
press w when finished.
It will create a result_<id>.json file in current folder.
generate report for the same.
- flashlight report result_<id>.json🍟Generated Reports


Flutter

React Native

Figuring Out the data further
- Extracting useful information from generated JSON data over the
nnumber of samples.
Let n=5, will be taking 5 samples for each scenario.
Scenarios:-
- RN IDLE (RN App doing nothing with the app)- Flutter IDLE (Flutter App doing nothing with the app)- RN With Interactivity *(for components you want to test)*- Flutter with Interactivity *(for components you want to test)*
2. Code to generate the combined data from all these samples:-
// utils.js
const getAverageFPS = (measures) => { const fps = measures.map((measure) => measure.fps); const total = fps.reduce((acc, val) => acc + val, 0); return (total / fps.length).toFixed(2); };
const getLowestFPS = (measures) => { const fps = measures.map((measure) => measure.fps); return Math.min(...fps).toFixed(2); };
const getAverageRAM = (measures) => { const ram = measures.map((measure) => measure.ram); const total = ram.reduce((acc, val) => acc + val, 0); return (total / ram.length).toFixed(2); };
const getHighestRAM = (measures) => { const ram = measures.map((measure) => measure.ram); return Math.max(...ram).toFixed(2); };
const convertObjToArray = (obj) => Object.keys(obj).map((key) => [key, obj[key]]);
const getThreadsTotal = (threadsObj) => { const threadsArray = convertObjToArray(threadsObj); return threadsArray.reduce((acc, val) => acc + val[1], 0); };
const getCPUUsage_allThreads_average = (measures) => { const newMeasures = measures.map((measure) => getThreadsTotal(measure.cpu.perName) );
// Average const total = newMeasures.reduce((acc, val) => acc + val); return (total / newMeasures.length).toFixed(2); };
const getCPUUsage_allThreads_highest = (measures) => { const newMeasures = measures.map((measure) => getThreadsTotal(measure.cpu.perName) );
return Math.max(...newMeasures).toFixed(2); };
// For RN // UI = UI Thread + RenderThread const getCPUUsage_UIThreads_highest = (measures) => { const newMeasures = measures.map((measure) => getThreadsTotal({ "UI Thread": measure.cpu.perName["UI Thread"], "(RenderThread)": measure.cpu.perName["(RenderThread)"], }) );
return Math.max(...newMeasures).toFixed(2); };
// For RN // JS = mqt_js + mqt_native_modu const getCPUUsage_JSThreads_highest = (measures) => { const newMeasures = measures.map((measure) => getThreadsTotal({ "(mqt_js)": measure.cpu.perName["(mqt_js)"], "(mqt_native_modu)": measure.cpu.perName["(mqt_native_modu)"], }) );
return Math.max(...newMeasures).toFixed(2); };
// for flutter // UI = "UI Thread" + "(1.ui)" + "(1.raster)" const getCPUUsage_UIThreadsFlutter_highest = (measures) => { const newMeasures = measures.map((measure) => getThreadsTotal({ "UI Thread": measure.cpu.perName["UI Thread"], "(1.ui)": measure.cpu.perName["(1.ui)"], "(1.raster)": measure.cpu.perName["(1.raster)"], }) );
return Math.max(...newMeasures).toFixed(2); };
const getAverage = (arrOfObj) => { var result = arrOfObj.reduce((acc, obj) => { Object.keys(obj).forEach((key) => { // check if it's a number if (!isNaN(parseFloat(obj[key]))) { acc[key] = acc[key] || { sum: 0, count: 0, avg: 0 }; acc[key].sum += Number(obj[key]); acc[key].count++; acc[key].avg = acc[key].sum / acc[key].count; } }); return acc; }, {});
return result; }; module.exports = { getAverageFPS, getLowestFPS, getAverageRAM, getHighestRAM, getCPUUsage_allThreads_average, getCPUUsage_allThreads_highest, getCPUUsage_UIThreads_highest, getCPUUsage_JSThreads_highest, getCPUUsage_UIThreadsFlutter_highest, getAverage, };
const fs = require("fs");
const { getAverageFPS,
getLowestFPS,
getAverageRAM,
getHighestRAM,
getCPUUsage_allThreads_average,
getCPUUsage_allThreads_highest,
getCPUUsage_UIThreads_highest,
getCPUUsage_JSThreads_highest,
getCPUUsage_UIThreadsFlutter_highest,
getAverage,
} = require("./utils");
/* Output.json Structure */
/* 'average': contains average over n-samples */
const results = {
flutter_idle: [],
rn_idle: [],
flutter_interactivity: [],
rn_interactivity: [],
flutter_interactivity_complete: [],
rn_interactivity_complete: [],
averages: {
flutter_idle: {},
rn_idle: {},
flutter_interactivity: {},
rn_interactivity: {},
flutter_interactivity_complete: [],
rn_interactivity_complete: [],
},
};
const FLUTTER_IDLE_SAMPLES = [
"./Flutter IDLE/sample1/results_1678957081784.json",
"./Flutter IDLE/sample2/results_1678957141647.json",
"./Flutter IDLE/sample3/results_1678957205705.json",
"./Flutter IDLE/sample4/results_1678957261876.json",
"./Flutter IDLE/sample5/results_1678957322941.json",
];
FLUTTER_IDLE_SAMPLES.map((sample, i) => {
const jsonString = fs.readFileSync(sample, { encoding: "utf8" });
const jsonData = JSON.parse(jsonString);
const measures = jsonData.iterations[0].measures.slice(5);
const obj = {
"Average FPS": getAverageFPS(measures),
"Lowest FPS": getLowestFPS(measures),
"Average CPU (all thread)%": getCPUUsage_allThreads_average(measures),
"Highest CPU (all thread)%": getCPUUsage_allThreads_highest(measures),
"Highest CPU (UI thread)%": getCPUUsage_UIThreadsFlutter_highest(measures),
"Average RAM (in MB)": getAverageRAM(measures),
"Highest RAM (in MB)": getHighestRAM(measures),
};
results.flutter_idle.push(obj);
});
results.averages.flutter_idle = getAverage(results.flutter_idle);
const RN_IDLE_SAMPLES = [
"./RN_IDLE/sample1/results_1678337301627.json",
"./RN_IDLE/sample2/results_1678956062174.json",
"./RN_IDLE/sample3/results_1678956131599.json",
"./RN_IDLE/sample4/results_1678956188637.json",
"./RN_IDLE/sample5/results_1678956250400.json",
];
RN_IDLE_SAMPLES.map((sample, i) => {
const jsonString = fs.readFileSync(sample, { encoding: "utf8" });
const jsonData = JSON.parse(jsonString);
const measures = jsonData.iterations[0].measures.slice(2);
const obj = {
"Average FPS": getAverageFPS(measures),
"Lowest FPS": getLowestFPS(measures),
"Average CPU (all thread)%": getCPUUsage_allThreads_average(measures),
"Highest CPU (all thread)%": getCPUUsage_allThreads_highest(measures),
"Highest CPU (UI thread)%": getCPUUsage_UIThreads_highest(measures),
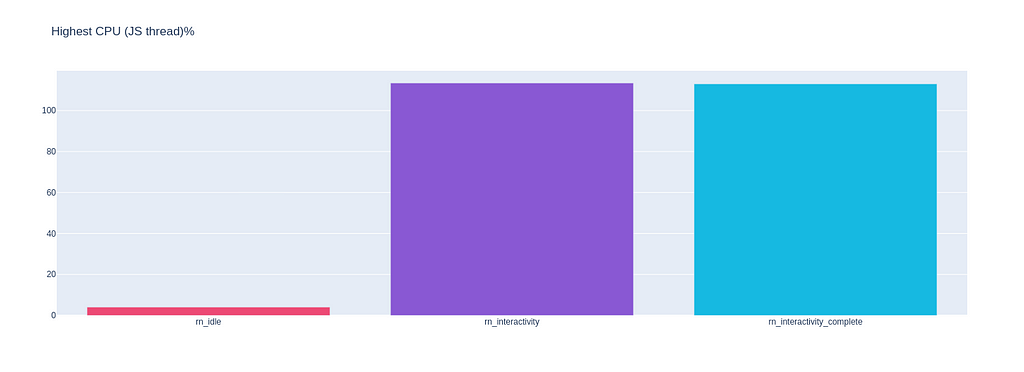
"Highest CPU (JS thread)%": getCPUUsage_JSThreads_highest(measures),
"Average RAM (in MB)": getAverageRAM(measures),
"Highest RAM (in MB)": getHighestRAM(measures),
};
results.rn_idle.push(obj);
});
results.averages.rn_idle = getAverage(results.rn_idle);
// ... do similar for other samples
// My Implementation
// 🌲🌲🌲🌲🌲🌲🌲🌲🌲🌲🌲🌲🌲🌲🌲🌲🌲🌲🌲🌲🌲🌲
// Link : https://github.com/jugshaurya/rn_vs_flutter/blob/main/analyse.js
// 🌲🌲🌲🌲🌲🌲🌲🌲🌲🌲🌲🌲🌲🌲🌲🌲🌲🌲🌲🌲🌲🌲
// ...
// saving data to file.
const jsonData = JSON.stringify(results, null, 2);
fs.writeFileSync("output.json", jsonData, { encoding: "utf8" });
console.log("Data saved in output.json 🎊🎊");
3. Output.json looks like this:-

output.json
🍟Comparison Table generated using all that

Charts according to the table using python and output.json:
# -*- coding: utf-8 -*-
"""charts.ipynb
Automatically generated by Colaboratory.
🌲🌲🌲🌲Try @google colab, and run below code to generate charts.🌲🌲🌲
"""

import pandas as pd

import json

data = json.load(open('output.json'))

scenarios = []
content = {}
only_react_scenarios = []

for key in data["averages"]:
  if(key[0]=='r'):
    only_react_scenarios.append(key)

  scenarios.append(key)
  for subkey in data["averages"][key]:
    if subkey in content:
        content[subkey].append(data["averages"][key][subkey]["avg"])
    else:
        content[subkey] = [data["averages"][key][subkey]["avg"]]

print(content)

import matplotlib.pyplot as plt
import plotly.graph_objects as go
import os
if not os.path.exists("images"):
    os.mkdir("images")

colors = ["#ED4974", "#8958D3", "#16B9E1","#58DE7B", "#F0D864","#FF8057"]

# import plotly.express as px
# print(px.data.tips())
for key in content:
  if(key != 'Highest CPU (JS thread)%'):
    fig = go.Figure(data=[go.Bar(
        x=scenarios,
        y=content[key],
        marker_color=colors # marker color can be a single color value or an iterable
    )])
    fig.update_layout(title_text=key)

    # fig = px.bar(y=content[key] , x=scenarios, title=key, color="red")
    fig.show()
    # fig.write_image("/images/" + key + ".png")
  else:
    fig = go.Figure(data=[go.Bar(
        x=only_react_scenarios,
        y=content[key],
        marker_color=colors # marker color can be a single color value or an iterable
    )])
    fig.update_layout(title_text=key)

    # fig = px.bar(y=content[key] , x=only_react_scenarios, title=key)
    fig.show()


🍟Complete Code
Link(https://github.com/jugshaurya/rn_vs_flutter), for more/updated details.
That’s it!
We learned a lot of things, Congrats! You completed this piece of content.🫂Have fun, keep learning, and always keep coding.🎊🎊🎊.
Follow for more content, star the project on GitHub, and give a clap if you want to here.
This is Shaurya Singhal, Signing Off, Sayonara✌.
Other Articles to research on the topic: https://www.callstack.com/blog/profiling-react-native-apps-with-ios-and-android-tools