
Source: View original notebook on GitHub
Category: Machine Learning / Learn ML
Introduction
Have you come across a situation when a Chief Marketing Officer of a company tells you – “Help me understand our customers better so that we can market our products to them in a better manner!”
I did and the analyst in me was completely clueless what to do! I was used to getting specific problems, where there is an outcome to be predicted for various set of conditions. But I had no clue what to do in this case. If the person would have asked me to calculate Life Time Value (LTV) or propensity of Cross-sell, I wouldn’t have blinked. But this question looked very broad to me.
This is usually the first reaction when you come across an unsupervised learning problem for the first time! You are not looking for specific insights for a phenomena, but what you are looking for are structures with in data with out them being tied down to a specific outcome.
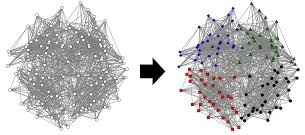
The method of identifying similar groups of data in a dataset is called clustering. It is one of the most popular techniques in data science. Entities in each group are comparatively more similar to entities of that group than those of the other groups. In this article, I will be taking you through the types of clustering, different clustering algorithms and a comparison between two of the most commonly used clustering methods.
Let’s get started.
```
## 1. Clustering
Clustering is the task of dividing the population or data points into a number of groups such that data points in the same groups are more similar to other data points in the same group than those in other groups. In simple words, the aim is to segregate groups with similar traits and assign them into clusters.
Let’s understand this with an example. Suppose, you are the head of a rental store and wish to understand preferences of your costumers to scale up your business. Is it possible for you to look at details of each costumer and devise a unique business strategy for each one of them? Definitely not. But, what you can do is to cluster all of your costumers into say 10 groups based on their purchasing habits and use a separate strategy for costumers in each of these 10 groups. And this is what we call clustering.
Now, that we understand what is clustering.
## 2. Types of Clustering
Broadly speaking, clustering can be divided into two subgroups :
**Hard Clustering:**
In hard clustering, each data point either belongs to a cluster completely or not. For example, in the above example each customer is put into one group out of the 10 groups.
**Soft Clustering:**
In soft clustering, instead of putting each data point into a separate cluster, a probability or likelihood of that data point to be in those clusters is assigned. For example, from the above scenario each costumer is assigned a probability to be in either of 10 clusters of the retail store.**
# 3. Types of clustering algorithms
Every methodology follows a different set of rules for defining the ‘similarity’ among data points.
**Connectivity models or Hierarchical Clustering Model **:
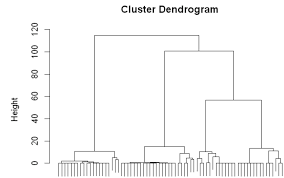
- Hierarchical clustering is a general family of clustering algorithms that build nested clusters by merging or splitting them successively. This hierarchy of clusters is represented as a tree (or dendrogram). The root of the tree is the unique cluster that gathers all the samples, the leaves being the clusters with only one sample.
- These models are based on the notion that the data points closer in data space exhibit more similarity to each other than the data points lying farther away.
These models can follow two approaches.
1. Take each data points into separate clusters => then aggregating them as the distance decreases.
2. Take all data points as a single cluster => then partitioned as the distance increases.
The choice of distance function is subjective.
These models are very easy to interpret but lacks scalability for handling big datasets. Examples of these models are hierarchical clustering algorithm and its variants.
3. Dendograms are made in them.
4. Divisive(point 2 or say top-down approach) and Agglomerative Clustering (point 1 or say bottom up approach)
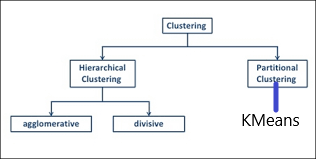
**Centroid models or Partition Clustering :**
These are iterative clustering algorithms in which the notion of similarity is derived by the closeness of a data point to the centroid of the clusters.
K-Means clustering algorithm is a popular algorithm that falls into this category.
In these models, the no. of clusters required at the end have to be mentioned beforehand, which makes it important to have prior knowledge of the dataset. These models run iteratively to find the local optima.
**Density Models:**
These models search the data space for areas of varied density of data points in the data space. It isolates various different density regions and assign the data points within these regions in the same cluster.
Popular examples of density models are DBSCAN and OPTICS.
- The DBSCAN algorithm views clusters as areas of high density separated by areas of low density. Due to this rather generic view, clusters found by DBSCAN can be any shape, as opposed to k-means which assumes that clusters are convex shaped. The central component to the DBSCAN is the concept of core samples, which are samples that are in areas of high density. A cluster is therefore a set of core samples, each close to each other (measured by some distance measure) and a set of non-core samples that are close to a core sample (but are not themselves core samples). There are two parameters to the algorithm, min_samples and eps, which define formally what we mean when we say dense. Higher min_samples or lower eps indicate higher density necessary to form a cluster.
## 4. Difference between K Means and Hierarchical clustering
1. Hierarchical clustering can’t handle big data well but K Means clustering can. This is because the time complexity of K Means is linear i.e. O(n) while that of hierarchical clustering is quadratic i.e. O(n2).
2. In K Means clustering, since we start with random choice of clusters, the results produced by running the algorithm multiple times might differ. While results are reproducible in Hierarchical clustering.
3. K Means is found to work well when the shape of the clusters is hyper spherical (like circle in 2D, sphere in 3D).
4. K Means clustering requires prior knowledge of K i.e. no. of clusters you want to divide your data into. But, you can stop at whatever number of clusters you find appropriate in hierarchical clustering by interpreting the dendrogram
Partitioning clustering
Partitioning algorithms are clustering techniques that subdivide the data sets into a set of k groups, where k is the number of groups pre-specified by the analyst.
There are different types of partitioning clustering methods. The most popular is the K-means clustering (MacQueen 1967), in which, each cluster is represented by the center or means of the data points belonging to the cluster. The K-means method is sensitive to outliers.
An alternative to k-means clustering is the K-medoids clustering or PAM (Partitioning Around Medoids, Kaufman & Rousseeuw, 1990), which is less sensitive to outliers compared to k-means.
Hierarchical clustering
Hierarchical clustering is an alternative approach to partitioning clustering for identifying groups in the dataset. It does not require to pre-specify the number of clusters to be generated.
The result of hierarchical clustering is a tree-based representation of the objects, which is also known as dendrogram. Observations can be subdivided into groups by cutting the dendrogram at a desired similarity level.
Fuzzy clustering
Fuzzy clustering is also known as soft method. Standard clustering approaches produce partitions (K-means, PAM), in which each observation belongs to only one cluster. This is known as hard clustering.
In Fuzzy clustering, items can be a member of more than one cluster. Each item has a set of membership coefficients corresponding to the degree of being in a given cluster. The Fuzzy c-means method is the most popular fuzzy clustering algorithm.
Read more: Fuzzy Clustering.
Model-based clustering
In model-based clustering, the data are viewed as coming from a distribution that is mixture of two ore more clusters. It finds best fit of models to data and estimates the number of clusters.
Read more: Model-Based Clustering.
DBSCAN: Density-based clustering
DBSCAN is a partitioning method that has been introduced in Ester et al. (1996). It can find out clusters of different shapes and sizes from data containing noise and outliers (Ester et al. 1996). The basic idea behind density-based clustering approach is derived from a human intuitive clustering method.
The description and implementation of DBSCAN in R are provided at this link: DBSCAN: Density-Based Clustering.
Density based clustering